Temperature Trends & Projections: Past, Present & Future Climate Insights
Temperature is one of the primordial variable in the formation of Planet Earth and in its evolution for all the 4.6 billion years. This planet happens to be life sustaining and habitable owing to its appropriateness in its orbital distance relative to the Sun called the Goldilocks Zone, which is based on the criterion “Temperature”. The average temperature of the Earth fluctuates between hot and cold temperatures every tens of thousands of years, and correspondingly, the temperature prevailing over a particular period has a larger impact on the existence and the sustainability of life on this planet.
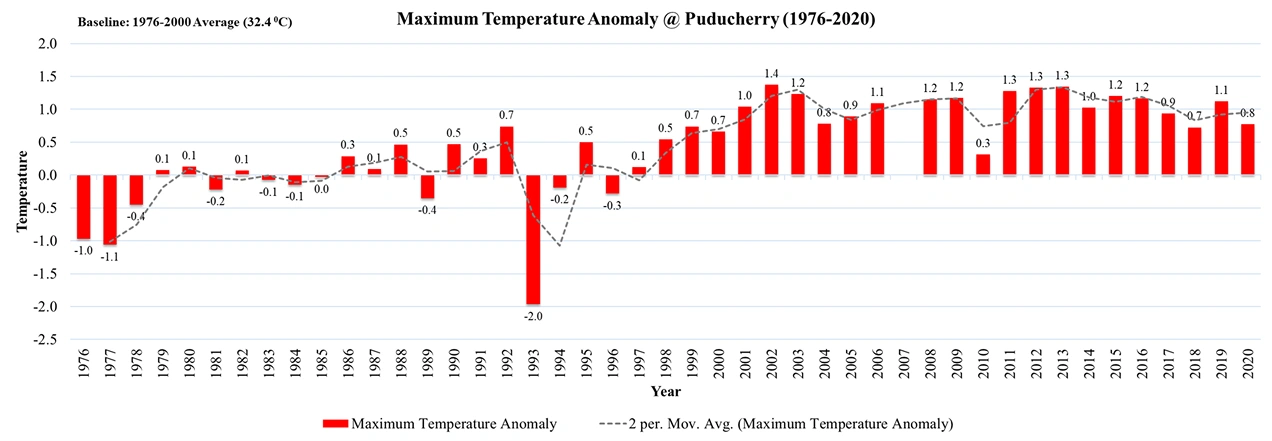
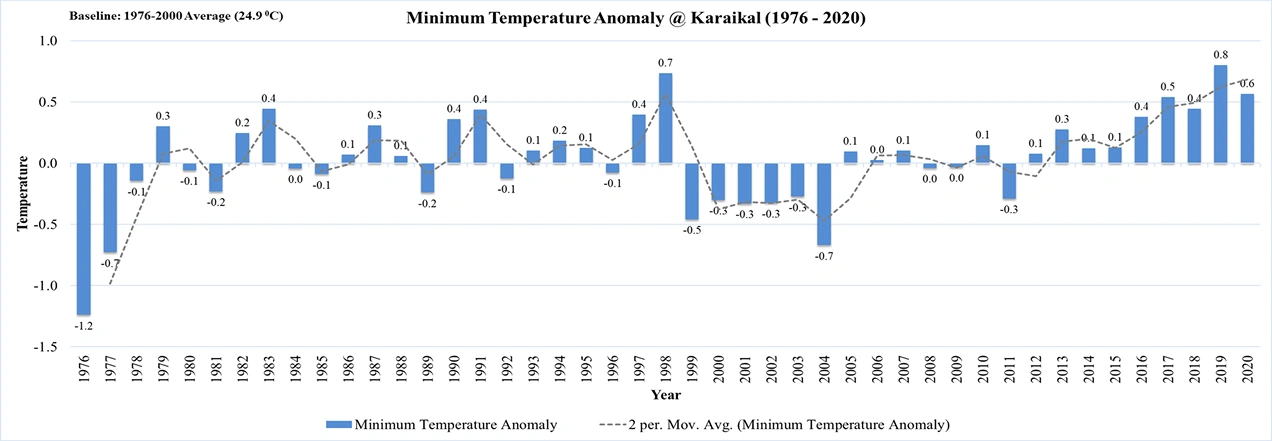
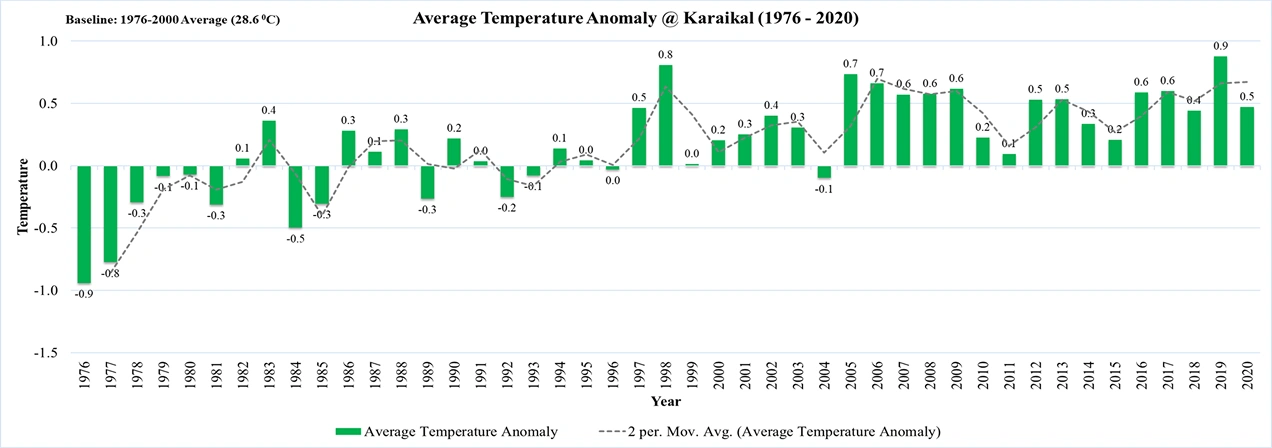
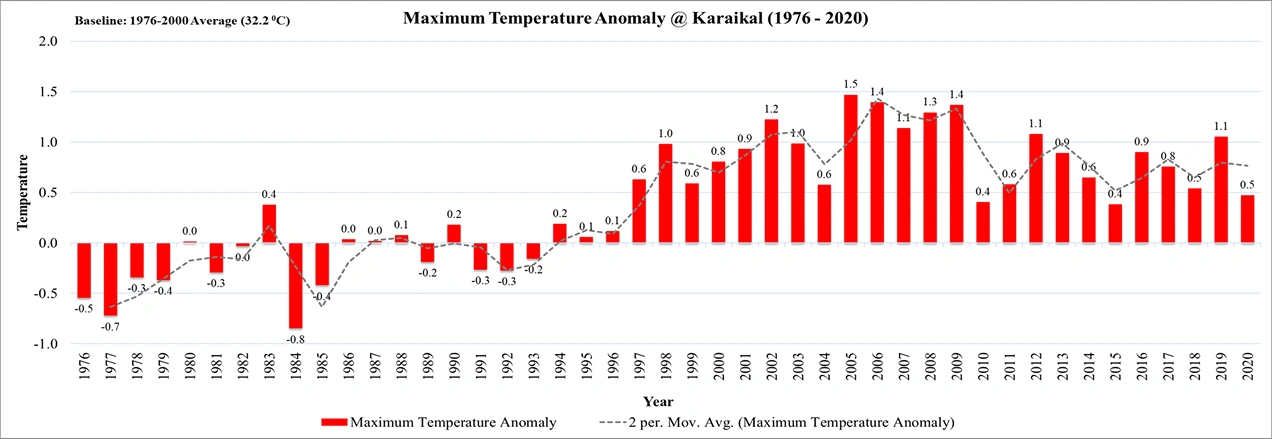
In the present times, observed global mean surface temperature for the decade 2006–2015 was 0.87°C higher than the average over the 1850–1900 period, and this increase of global warming is likely to reach 1.5°C between 2030 and 2052 if it continues to increase at the current rate (IPCC, 2018). In this context, it is necessary to evaluate the trend of rise in temperature of the recent past in order to keep track and to project the rise in temperature for the future. Following are the Temperature in U.T. of Puducherry.
Select:
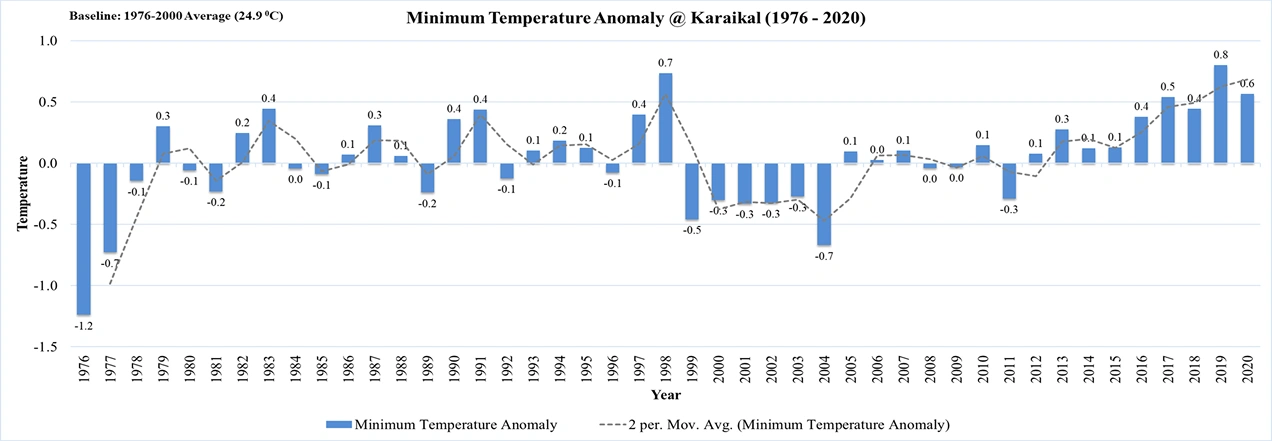
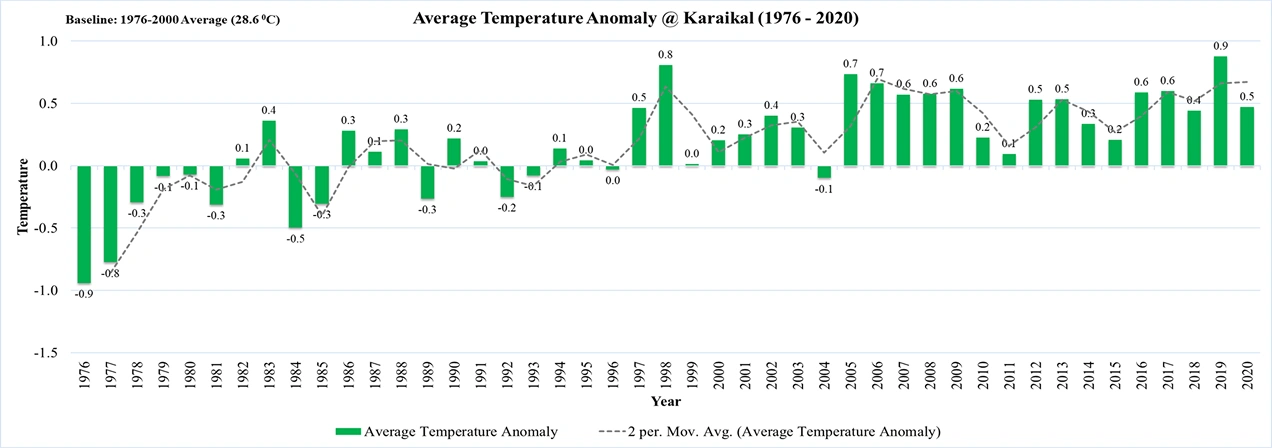
- A temperature anomaly is the departure from an average temperature calculated between a specific period (baseline average) and the observed temperature of a particular year.
- A positive anomaly indicates the observed temperature was warmer than the baseline, while a negative anomaly indicates the observed temperature was cooler than the baseline.
- The anomaly graph presented here was computed with a baseline of 1976 – 2000 for the maximum, minimum and average temperature for both Puducherry and Karaikal regions and the results.


